Creating an Image Chart
In this tutorial you will learn how to create an Image visualization using a sample spreadsheet.
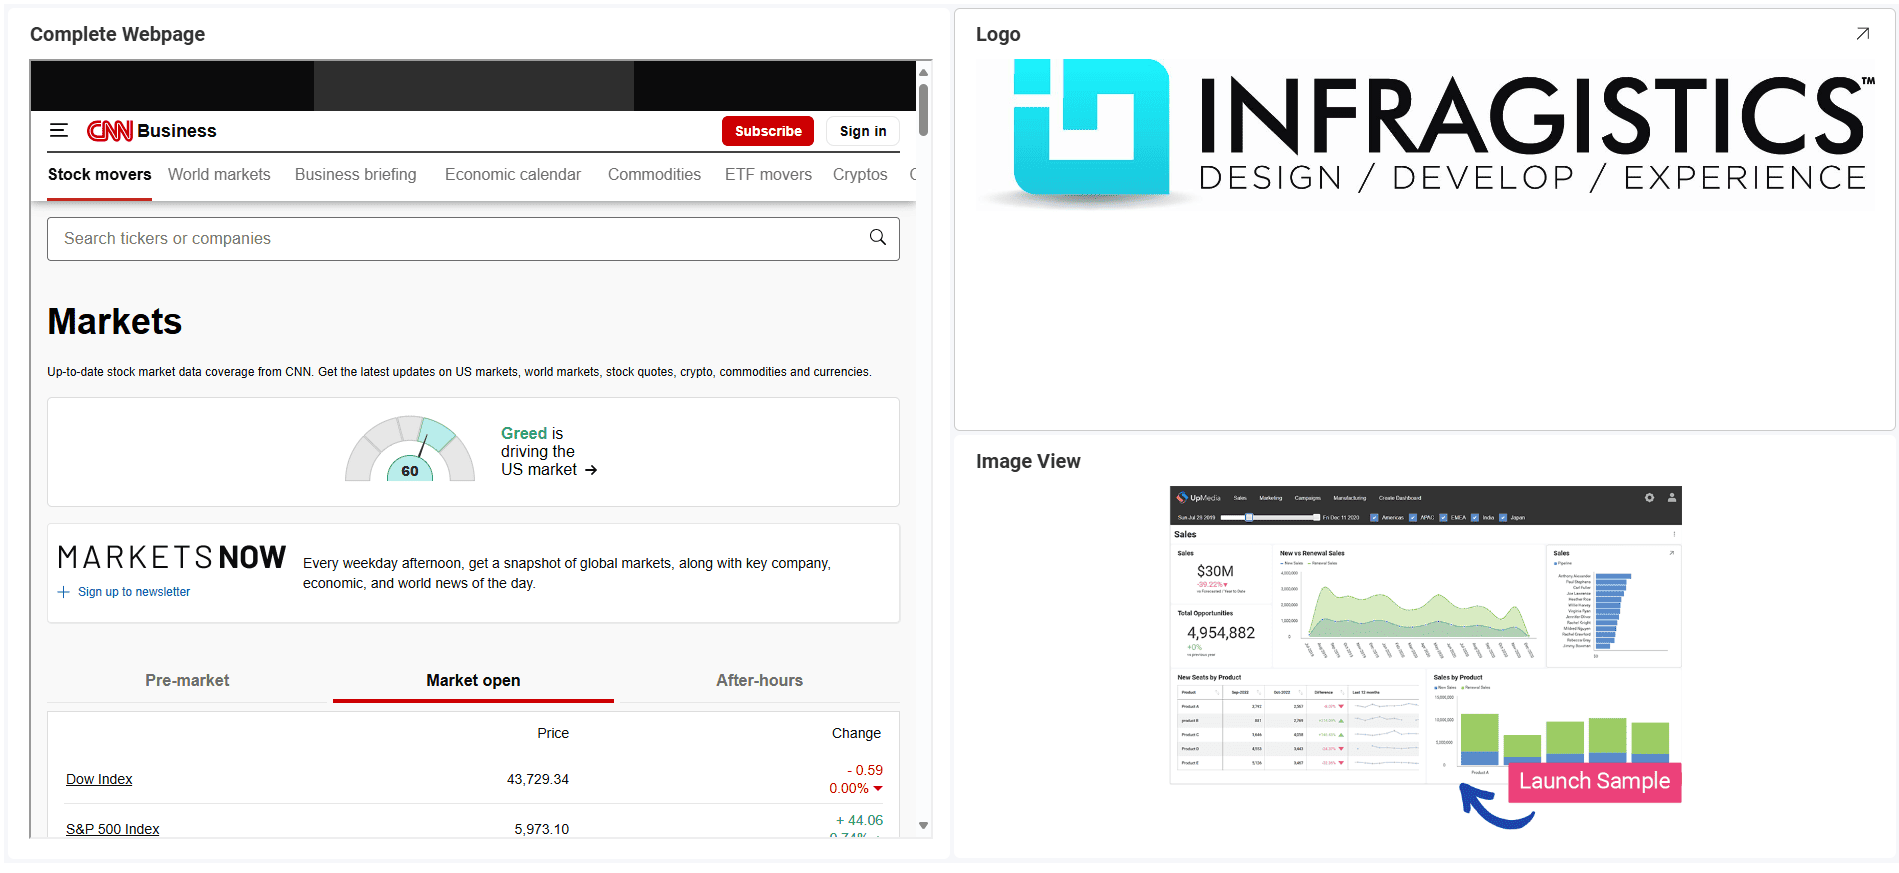
Key Concepts
As mentioned in the Data Visualization section, the Image Chart displays information in an embedded browser by making a request to a URL and displaying the results. The data source, therefore, will need to:
-
Include a link to a web resource to be displayed in the widget.
-
Include it in the first row of the data set.
Sample Data Source
For this tutorial, you will use the Image Chart sheet in the Reveal Visualization Tutorials.
-
Choose Edit in overflow menu.

-
Select the + Visualization button in the top right-hand corner.

-
Select your data source from the list of data sources.

-
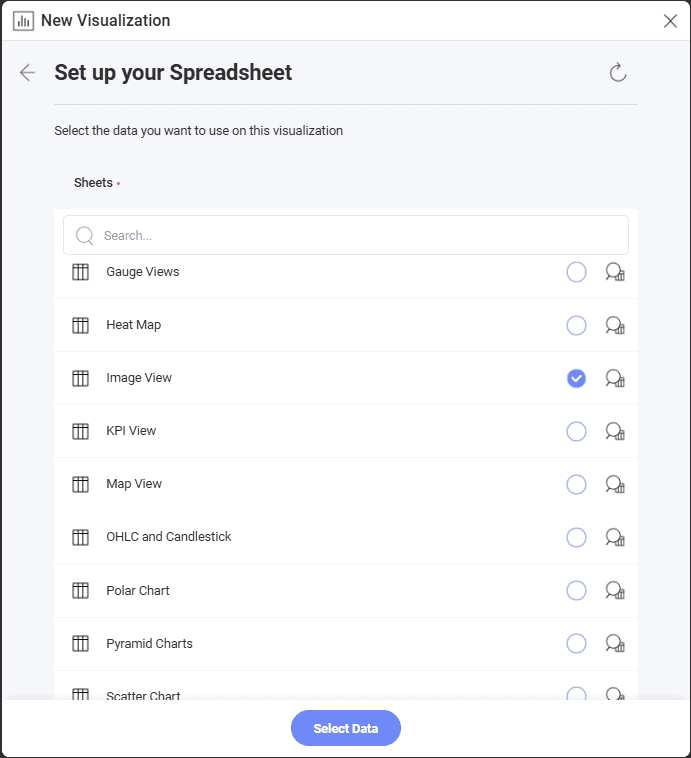
Once the data source is configured, select the Image View sheet.
-
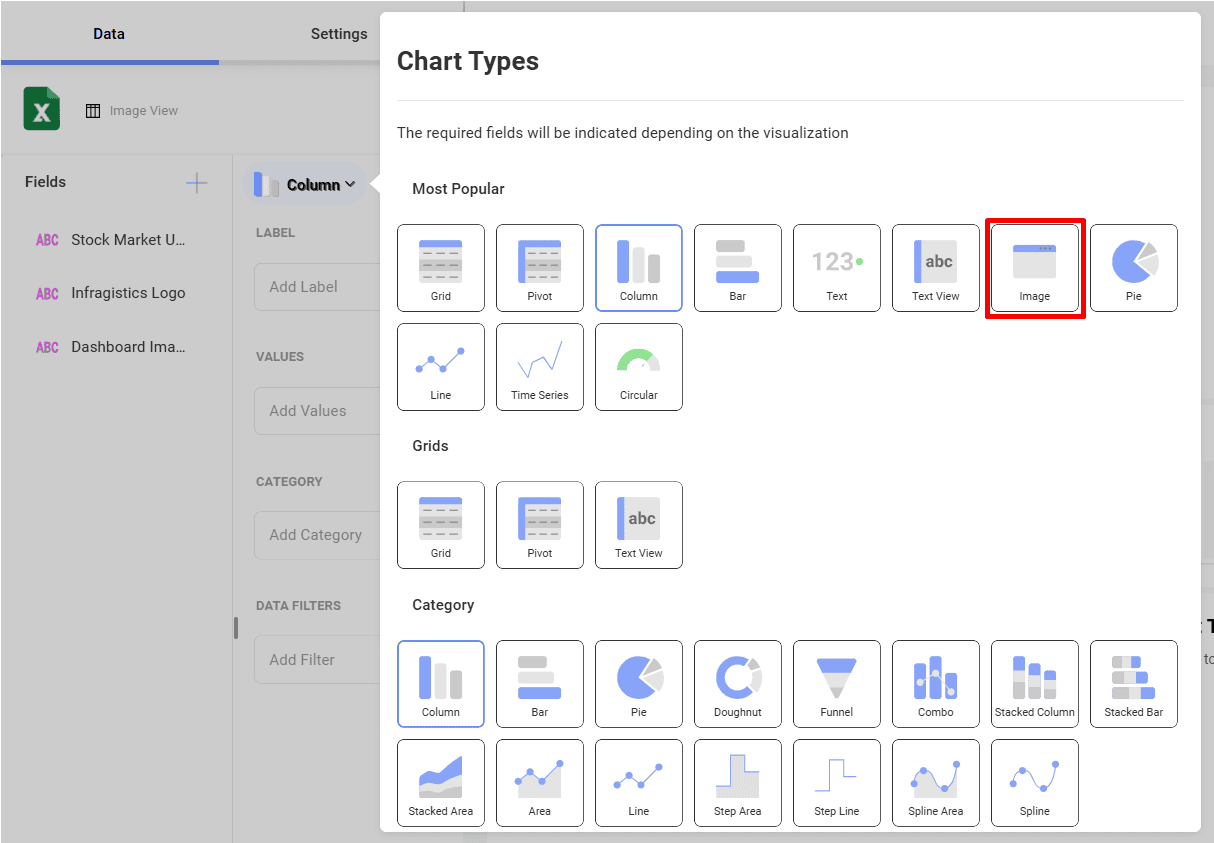
By default, the visualization type will be set to Column. Select the Image option.
-
Drag any of the available fields into URL.
